



Why is Kathmandu hotter than the farmland that surrounds it, even when both sit at the same altitude under the same sky? That question has a measurable answer, and researchers have been quantifying it for three decades. A city built of fired brick, paved with asphalt, and steadily stripped of its tree cover absorbs solar energy during the day and releases it slowly at night. Scientists call the result an urban heat island Kathmandu residents feel most acutely in the pre-monsoon weeks of April and May. Here is what the data shows, what drives it, and where the evidence is still thin.
What an Urban Heat Island Actually Is
An urban heat island is the temperature difference between a built-up area and the rural land around it. Two versions get measured. Air temperature heat islands are recorded by thermometers at human height. Surface heat islands, often written as SUHI, are measured by satellite sensors reading the temperature of roofs, roads and soil. Satellites give far better spatial coverage, so most Kathmandu research uses surface data.
Those two numbers are not interchangeable. A black asphalt road can reach 50 degrees Celsius at the surface while the air a meter above it sits at 32. Readers should treat satellite land surface temperature as a map of where heat is generated, not as a reading of what a pedestrian experiences.


The Measured Record in the Kathmandu Valley
A study by Md. Omar Sarif, Bhagawat Rimal and Nigel E. Stork, published in ISPRS International Journal of Geo-Information in 2020, tracked land use and land surface temperature across roughly 694 square kilometers of the Kathmandu, Lalitpur and Bhaktapur districts between 1988 and 2018. Their findings are the clearest long record available.
- Built-up, impervious surface grew by 113.44 square kilometers over the 30 years, equal to 16.34 percent of the whole study area.
- Agricultural land fell by 118.29 square kilometers, or 17.03 percent of the area. Fields became neighborhoods, almost acre for acre.
- Average land surface temperature rose by roughly 5 to 7 degrees Celsius inside the city and 3 to 5 degrees at the city edge.
- Broken down by surface type, impervious surfaces warmed most, with a mean increase of 7.11 degrees. Natural vegetation warmed least, at 3.18 degrees.
Those last two numbers carry the argument. Surface type, not just regional climate warming, explains most of the difference. Where the valley kept its vegetation, it warmed less than half as much as where it was paved.
| Land cover | Mean LST increase |
|---|---|
| Impervious / built-up surface | 7.11 °C |
| Natural vegetation | 3.18 °C |
| City-wide average (urban core) | approx. 5 to 7 °C |
| City boundary zone | approx. 3 to 5 °C |
| Source: Sarif, Rimal and Stork, ISPRS Int. J. Geo-Inf. 9(12), 726, 2020. | |
A separate 2022 paper by Sabina Bhandari and Chuanrong Zhang in the journal Land found Landsat-derived surface temperature maxima in Kathmandu Metropolitan City rising from 312.13 K in 2017 to 319.21 K in 2021, with the hottest zones concentrated around Tribhuvan International Airport and the dense city core. Four years is a short window, and single-date satellite scenes are sensitive to weather on the day of capture. Read that trend as suggestive rather than settled.
Why the Valley Shape Makes It Worse
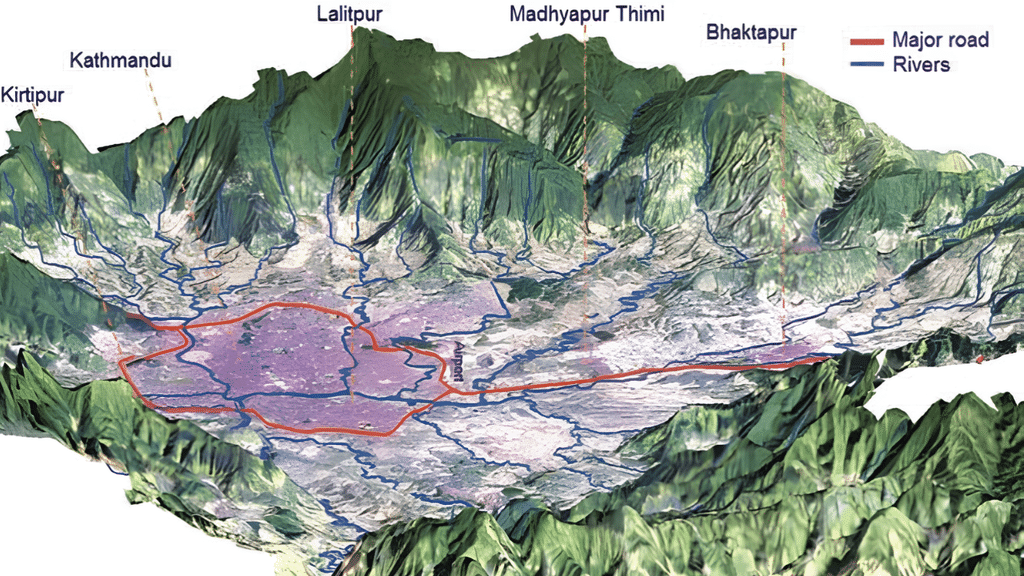
Kathmandu sits in a bowl. Hills ring the valley on all sides, and the Bagmati drains it through a single narrow gap at Chobhar. Cold air pools in that bowl on winter nights, and warm, polluted air struggles to flush out when winds are weak. Geography that gives the valley its famously mild climate also traps what the city produces.
Add the surfaces. Fired brick, concrete and asphalt have high thermal mass. They absorb heat through the day and radiate it back after sunset, which is why the heat island signal is often strongest at night rather than at noon. Soil and vegetation behave differently. Plants move water into the air through transpiration, a process that consumes energy and cools the surrounding air. Replace a field with a parking lot and that cooling mechanism simply disappears.
Brick Kilns: Heat, Soot, and Soil
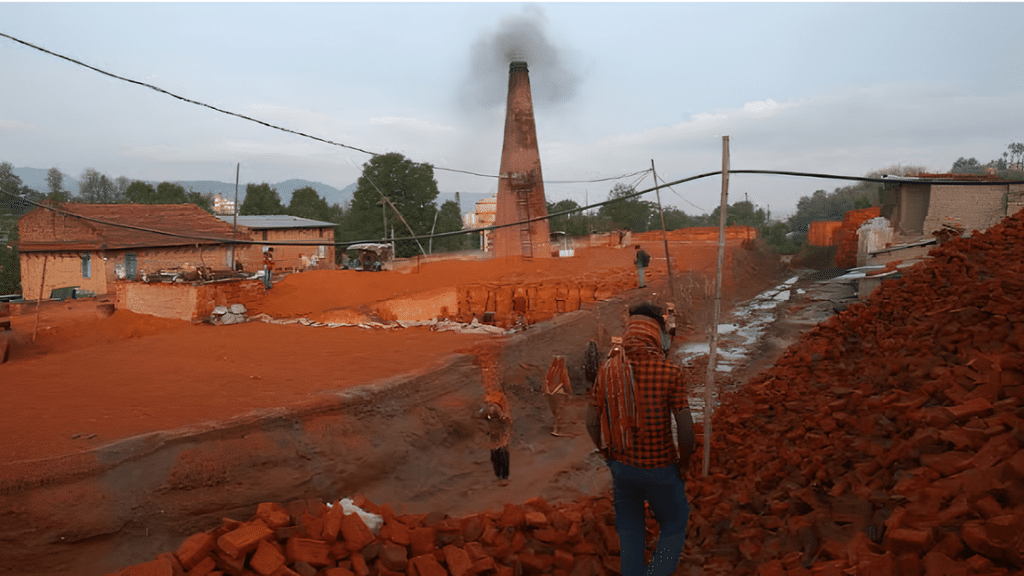
Brick kilns sit at the center of Kathmandu’s environmental arguments, and they matter to heat in three separate ways. First, they burn large volumes of coal. Second, they emit black carbon, a sooty particle that absorbs sunlight directly in the atmosphere. Third, they consume the valley’s agricultural topsoil as raw material, converting farmland into the very impervious material that paves the city.
Figures from the Department of Environment, compiled in a policy brief from the Urban Health Initiative, counted 110 kilns in the valley in 2017: 63 in Bhaktapur, 32 in Lalitpur and 15 in Kathmandu district. Reporting by the Kathmandu Post in January 2026 put the current valley figure at 89 kilns across the three districts, within a national industry of 1,349 registered brick factories producing 5.14 billion bricks a year. Note that the same reporting elsewhere describes around 800 kilns actually operating, so registered capacity and active capacity are not the same number.
Emissions estimates vary by method and should be quoted carefully:
- The Department of Environment has estimated valley kilns emit close to 4,000 tonnes of particulate matter a year, and attributed about 9 percent of PM10 emissions to them.
- Kim and colleagues, cited in the same policy brief, estimated kilns account for roughly 40 percent of black carbon in Kathmandu during winter. Winter is the key qualifier, because the firing season runs through the dry months.
- Valley kilns consume more than 56,100 tonnes of coal and about 330 tonnes of local fuels such as sawdust and wood each year, according to a Department of Environment study reported in 2026.
Black carbon is the piece most relevant to temperature. Unlike sulfate aerosols, which scatter light and cool the surface, black carbon absorbs solar radiation and warms the air layer it sits in. Deposited on snow and ice, it also darkens those surfaces and accelerates melt. How strongly South Asian black carbon affects regional temperature is an active research question, and estimates from different models disagree. Treat the direction of the effect as well established and the magnitude as contested.
What Changed in 2026
In April 2026 the Ministry of Forests and Environment published amended standards in the Nepal Gazette under the Environment Protection Act, 2019. New brick kilns must adopt zigzag firing technology, which staggers brick stacking to improve airflow and combustion efficiency. Existing kilns without it have two years from enforcement to convert. Particulate emissions from brick factories are capped at 250 mg per normal cubic meter, minimum chimney heights are set by kiln type, and highly polluting fuels including petroleum coke, tires and plastic are banned.
Enforcement is the open question. Peer-reviewed work comparing straight-line and zigzag kilns in Nepal has found meaningful emission reductions from the conversion, but a standard only delivers if monitoring follows. Air quality expert Bhupendra Das, quoted in the Kathmandu Post, has pointed out that minimum coal quality standards requested of the Nepal Bureau of Standards and Metrology had still not been drafted as of early 2026.
Canopy Loss and the Cooling the Valley Gave Away
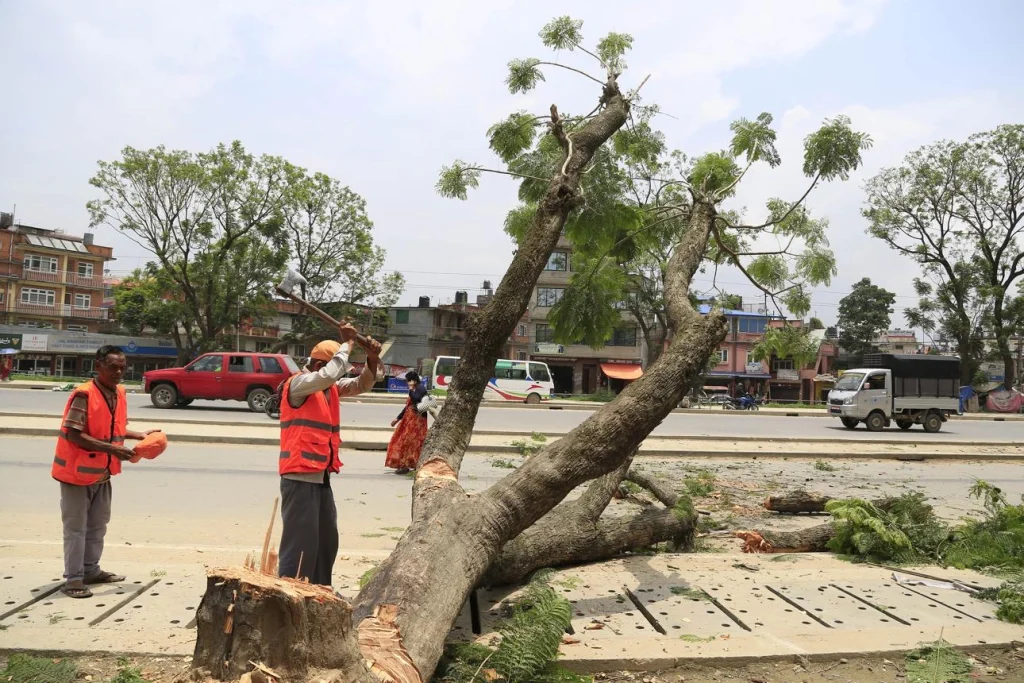
Trees cool cities in two ways: they shade surfaces that would otherwise absorb sunlight, and they transpire water. Both effects are local and immediate, which is why canopy is the fastest lever a municipality has.
Kathmandu has been moving the other way. Road widening and construction have removed mature roadside trees across the valley over the past two decades, and the Sarif study’s figures show vegetation holding roughly steady in area while agriculture collapsed and built-up land expanded. Available research describes existing urban green spaces in Kathmandu Metropolitan City as sparse and poorly maintained, but a current, verified citywide canopy percentage is not something we could confirm from an authoritative source. Several figures circulate in media coverage; we have left them out rather than repeat an unsourced number.
Worth saying plainly: canopy benefits are unevenly distributed. Older settlements with courtyards and temple compounds hold shade and water differently from newer peripheral housing built to the plot line. Heat exposure in Kathmandu is partly a question of which neighborhood you live in.
Who Carries the Risk
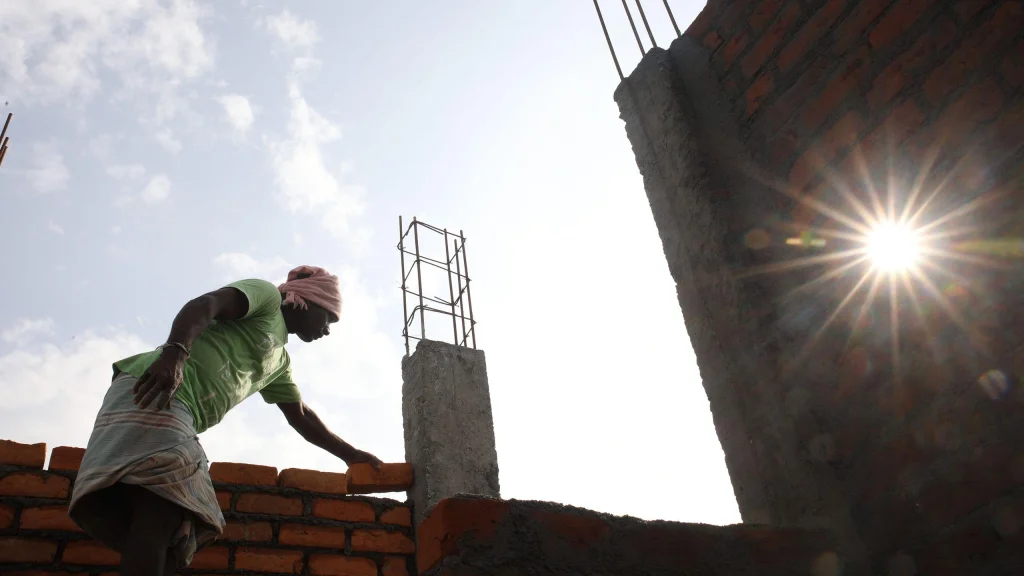
Heat is not an abstraction for outdoor workers. Construction laborers, brick molders, street vendors, traffic police and delivery riders work through the hottest hours with limited shade. Research on health burdens in the valley has focused more on air pollution than on heat, and Nepal does not yet have the long urban heat health record that cities in India and Pakistan have built. That is a genuine gap in the evidence, not a reason to assume the risk is small.
Air pollution’s burden is better quantified. Reporting in 2026 cited roughly 26,000 premature deaths a year nationally and a 3.4 year reduction in life expectancy, with economic costs above 6 percent of GDP. Heat and air pollution share sources, so measures that cut one often cut the other.
What Actually Lowers Urban Temperature
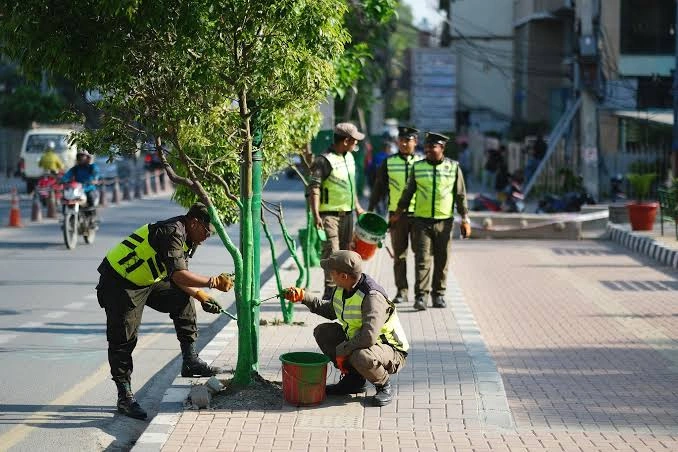
Evidence from cities worldwide points to a short list of interventions that work, ranked roughly by cooling per rupee:
- Preserve existing mature trees. A 40 year old tree cannot be replaced by a sapling for decades. Protecting canopy is cheaper than rebuilding it.
- Reflective and lighter-colored roofs. Cheap, fast and effective on the individual building scale, though the city-wide effect depends on uptake.
- Permeable surfaces and restored water bodies. The valley’s historic ponds and stone spouts were part of a working hydrology that moderated local climate.
- Cleaner kiln technology and fuel standards. Addresses black carbon and health burdens together.
- Shaded public space along commuting routes. Targets exposure where people actually stand.
None of these is exotic. Each requires sustained municipal attention, which has been the harder part.
Reading the Evidence Honestly
Three cautions are worth carrying into any discussion of Kathmandu’s heat. Satellite surface temperature is not air temperature. Short study windows can capture weather rather than climate. And emission inventories for the brick sector are estimates built on sampled kilns, not continuous measurement across every chimney. Researchers say so in their own papers. Reporting on their work should say so too.
What is not in dispute: the valley has replaced a very large area of vegetated and agricultural land with impervious surface in a single generation, and impervious surface in the Kathmandu Valley has warmed measurably more than vegetation over the same period.
Frequently Asked Questions
Is Kathmandu getting hotter because of climate change or because of urbanization?
Both, and they are hard to separate cleanly. Regional warming raises the baseline, while land cover change adds a local increment on top of it. The Sarif study’s finding that impervious surfaces warmed 7.11 °C against 3.18 °C for vegetation over the same 30 years, in the same valley, points to urbanization doing substantial work.
When is the urban heat island strongest?
Surface heat islands peak during the day, but the air temperature difference between city and countryside is often largest at night, when built surfaces release stored heat. In Kathmandu the pre-monsoon period of April and May combines high sun angle with dry, dusty air before the rains arrive.
How many brick kilns operate in the Kathmandu Valley?
The Department of Environment counted 110 in 2017. Reporting in January 2026 put the valley figure at 89 across Kathmandu, Lalitpur and Bhaktapur. Nationally, 1,349 brick factories are registered, with roughly 800 described as operating.
Does the monsoon end the heat island?
Rain and cloud cover suppress it substantially, and evaporative cooling from wet surfaces helps. The effect returns once dry conditions do. For how the seasons move through the valley, see our guide to the Nepal monsoon season.
What is zigzag kiln technology?
Bricks are stacked in a staggered, zigzag arrangement rather than straight lines, which lengthens the path hot gases travel and improves combustion. Better combustion means less unburned carbon leaving the chimney. Nepal’s 2026 standards require it for new kilns and give existing kilns two years to convert.
Is air pollution the same problem as urban heat?
Related but distinct. Black carbon links them directly, since soot both harms lungs and absorbs sunlight. Many solutions overlap, which is why kiln reform and vehicle emission policy appear in both conversations.
Do trees really make a measurable difference at city scale?
At street and neighborhood scale the effect is well documented and often several degrees of surface temperature. City-scale effects depend on how much canopy exists and how it is distributed. Scattered individual trees cool less per tree than connected canopy.
Is it safe to visit Kathmandu in the hottest months?
Yes, with ordinary precautions. May can be dusty and warm in the valley, and shade is scarce in newer districts. Travelers sensitive to heat often plan indoor heritage visits for the afternoon. Our piece on 40-degree days in Nepal’s cities covers what the hot season actually looks like.
Keep Exploring
Kathmandu’s heat story connects to the wider environmental picture across Nepal, from glacial retreat around the 8,000 meter peaks to how the valley’s own neighborhoods are changing, as in Kirtipur and the vehicle-free Saturday mela at Hadigaun. Save this guide, share it with someone planning a visit, and follow NepalVue for more reporting on the country’s landscapes and the science behind them.


