



How many mountains in Nepal rise above 8,000 meters? Until February 2025 the answer was eight. Then Nepal’s Department of Tourism published a revised peak profile adding six more, and the official count became fourteen. The new entries are subsidiary summits on the Kanchenjunga and Lhotse massifs rather than newly discovered mountains. That reclassification matters for more than record books, because the glaciers draining these massifs feed rivers that millions of people depend on, and the measurements of what is happening to them are thinner than most coverage suggests. This article sets out what is actually measured, what is modeled, and where glacial retreat in Nepal is genuinely uncertain.
First, the fourteen
Nepal’s Department of Tourism added four peaks in the Kanchenjunga range and two on Lhotse:
| Peak | Height | Massif |
|---|---|---|
| Yalung Khang | 8,505 m | Kanchenjunga |
| Kanchenjunga South | 8,476 m | Kanchenjunga |
| Kanchenjunga Central | 8,473 m | Kanchenjunga |
| Lhotse Middle | 8,410 m | Lhotse |
| Lhotse Shar | 8,400 m | Lhotse |
| Yalung Khang West | 8,077 m | Kanchenjunga |
Mountaineering convention generally treats a summit as independent when the connecting col drops at least 500 meters and the peak has a route not shared with another peak. By that test these six are subsidiary tops. Nepal’s decision followed a long process: a ten-member committee reported in November 2013, a peak profile subcommittee formed in January 2014 under Ang Tshering Sherpa, and the technical work was led from 2018 by the boundary expert Buddhi Narayan Shrestha. The International Mountaineering and Climbing Federation would need to approve the list for international recognition.


So both statements are true, and they answer different questions. Nepal officially lists fourteen peaks above 8,000 meters. Eight of the world’s fourteen independent eight-thousanders stand wholly or partly in Nepal.
The measurement problem
Here is the finding that should reframe everything else. Across the entire 3,500-kilometer arc of the Hindu Kush Himalaya, only about 38 glaciers have in-situ measurements, and just seven have been monitored annually for ten years or more.
Seven. For a mountain system supplying water to roughly two billion people.
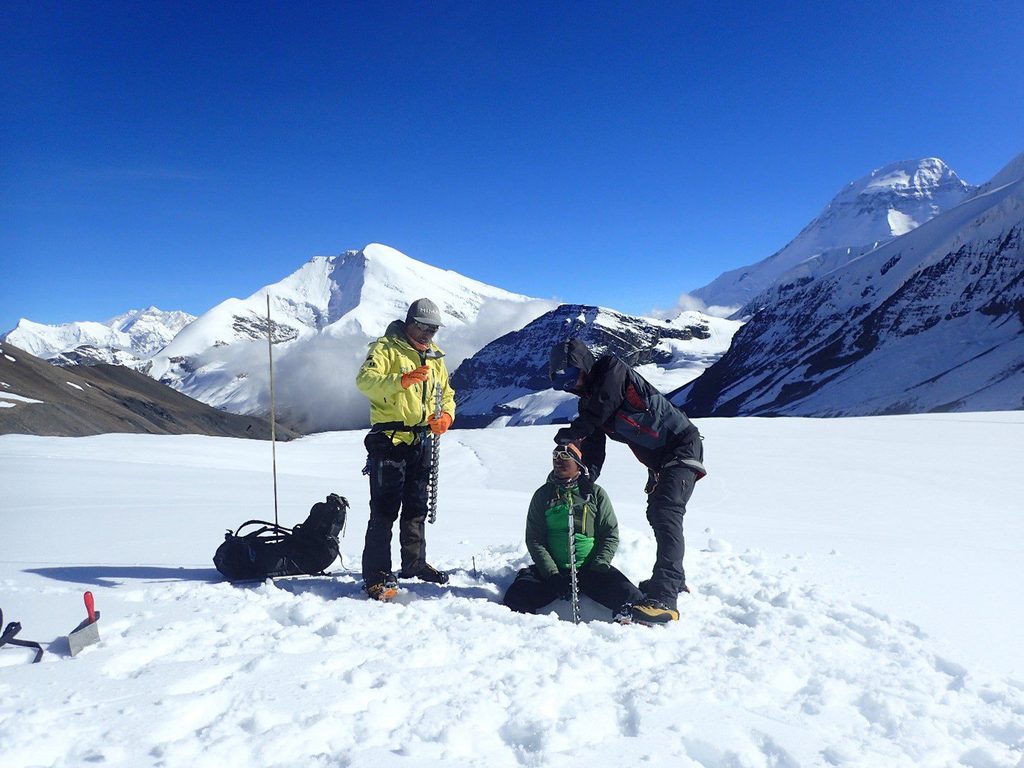
In-situ monitoring means people walking onto the ice and measuring it directly: stakes drilled into the surface, snow pits dug, mass balance calculated from accumulation minus melt. Everything else comes from satellites, which measure area and surface elevation well and measure mass change only by inference.
Satellite coverage is genuinely good and genuinely incomplete. Area change is straightforward to see. Volume change requires repeat elevation models with their own error budgets. Debris-covered glaciers, which are common in Nepal, are especially awkward because a layer of rock insulates the ice and decouples surface appearance from what the ice beneath is doing.
Yala, and what a fifty-year record looks like
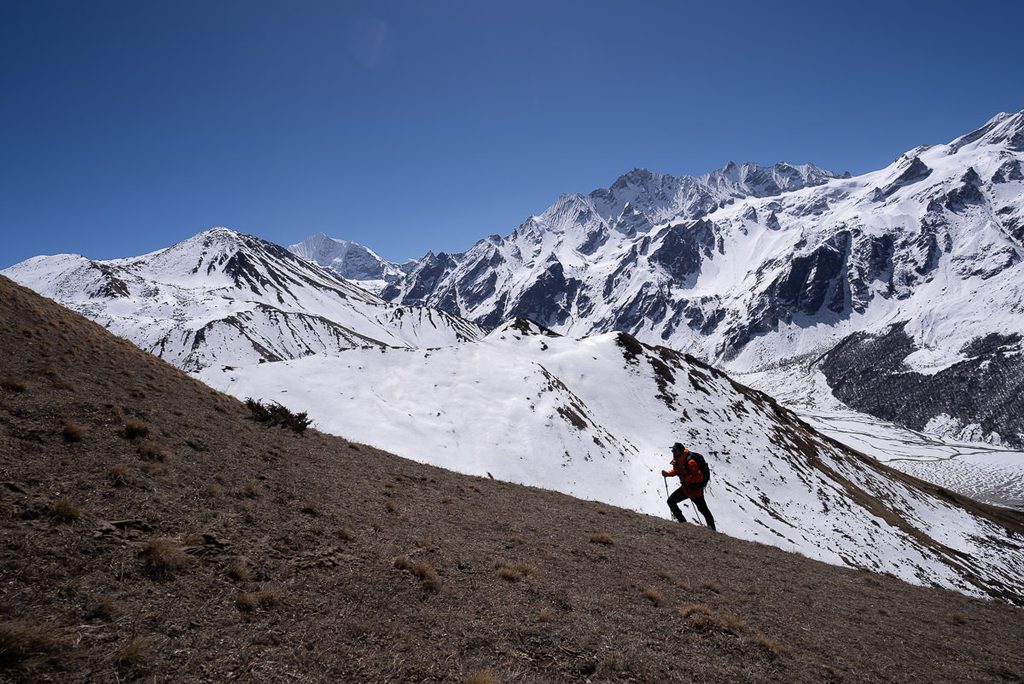
Yala Glacier in Langtang is one of the seven. Sitting above 5,000 meters, it has been a research site for five decades and a field training ground since 2011, where roughly 100 glaciologists from Afghanistan, China, India, Nepal and Pakistan have learned to measure ice.
Yala has lost 66% of its area and retreated 784 meters since the 1970s.
In May 2025, ICIMOD and local communities held a tribute for it. Yala is now small enough that researchers describe it as effectively finished as a glacier, and the ceremony marked the end of a monitoring record rather than a death in any biological sense. Plaques were installed. Buddhist ritual was performed by communities for whom these mountains hold religious meaning, a framing that belongs to those communities rather than to the visiting scientists.
Scientifically, the loss of Yala is a loss of one of the few long continuous records the region has.
What the regional numbers say
ICIMOD’s 2023 HI-WISE assessment, published on 20 June 2023, is the most comprehensive regional synthesis available. Its central measured finding: glaciers across the Hindu Kush Himalaya disappeared 65% faster in 2011 to 2020 than in the preceding decade.
Note the shape of that statistic. It compares two decades of loss rate against each other. It is not a statement that 65% of the ice is gone.
The projection is separate. On current emissions trajectories, HI-WISE finds the region’s glaciers could lose up to 80% of their present volume by 2100. That figure is modeled, it is scenario-dependent, and the range across emissions pathways is wide. Lower-emissions scenarios produce substantially smaller losses, and the uncertainty bands in glacier projections are larger than the headline numbers imply.
| Figure | Value | Measured or modeled |
|---|---|---|
| HKH glacier loss rate, 2011-2020 vs 2000-2010 | 65% faster | Measured (satellite-derived) |
| Yala Glacier area lost since 1970s | 66% | Measured (in-situ and satellite) |
| Yala Glacier retreat since 1970s | 784 m | Measured |
| Projected HKH volume loss by 2100 | Up to 80% | Modeled, scenario-dependent |
| HKH snow cover change under high emissions | Down by up to a quarter | Modeled |
| Glaciers with 10+ years of annual in-situ data | 7 across the HKH | Measured |
Globally, the world’s mountains have lost close to 9 trillion tonnes of ice since 1975. ICIMOD puts that in a usable image: an ice block the size of India, 2.72 meters thick.
Why the mountains warm faster
Nepal’s own record shows the altitude pattern clearly. The Department of Hydrology and Meteorology analyzed 1971 to 2014 data from 93 stations and found annual maximum temperature rising 0.056°C per year nationally, significant at the 99.9% confidence level. In the High Himalaya the trend reached 0.086°C per year. In the Tarai it was 0.021°C per year.
Winter warming in the High Himalaya ran at 0.101°C per year, the steepest seasonal figure in the analysis. Manang district recorded 0.118°C per year in winter maximum temperature, the highest district-level trend in the country.
Several mechanisms are proposed for this elevation-dependent warming: loss of snow cover exposing darker rock that absorbs more heat, changes in cloud and humidity at altitude, and deposition of black carbon on snow surfaces. Relative contributions remain an active research question, and attributing a specific share to each is not settled.
Minimum temperatures behave differently, and that is worth noting rather than smoothing over. Nationally the minimum temperature trend was 0.002°C per year and not statistically significant, with positive trends at lower elevations and negative trends at higher ones. Warming in Nepal is primarily a daytime-maximum phenomenon on this record, which is not the simple picture usually presented.
What happens to the water
Glacier melt behaves counterintuitively on the way to disappearing. As a glacier retreats, melt output initially rises, because more ice is exposed to warmer air. Flow increases. Then, as the glacier shrinks past a threshold, output falls and keeps falling. Hydrologists call the turning point peak water.
Different basins reach it at different times, depending on glacier size, elevation distribution and local climate. Some Himalayan basins are modeled as having passed it already; others are projected to reach it mid-century. Basin-level timing in Nepal is modeled rather than observed, and the models disagree.
Seasonality matters more than annual totals. Glacier melt contributes most during the pre-monsoon months of April and May, exactly when monsoon rain has not yet arrived and demand for irrigation is high. Losing that buffer hits hardest in the dry season, even if annual flow looks stable in the averages.
Nepal’s rivers are not primarily glacier-fed in volume terms. Monsoon rainfall dominates annual discharge. Glacier contribution is small in total and disproportionately important in the months when nothing else is supplying water.
The downstream consequences already visible
Retreating glaciers leave meltwater ponded behind unstable moraine ridges, and those lakes sometimes fail. ICIMOD identified around 200 glacial lakes across the HKH as dangerous, and the 2020 ICIMOD and UNDP inventory classified 21 lakes inside Nepal as potentially dangerous out of 2,070 mapped. Nepal’s rivers have carried floods of this kind before, as our coverage of the Bhotekoshi glacial flood records.
Thawing permafrost destabilizes slopes, which affects trails, bridges and settlements in the high valleys. Routes change. The approach to Everest Base Camp crosses terrain that is visibly different from photographs taken decades ago, as our Everest Base Camp background piece touches on, and snow conditions on high trails have become less predictable, which matters for anyone reading our high-altitude snowfall and safety guide. Nepal’s wider environmental policy debate is covered in our World Environment Day 2026 report.
Where the science is genuinely contested
Three areas deserve an honest label.
Basin-scale peak water timing is contested. Models produce different answers depending on how they handle debris cover, precipitation at altitude where gauges are sparse, and ice thickness, which is itself largely inferred rather than measured.
Black carbon’s contribution to Himalayan melt is actively debated. Deposition of soot darkens snow and increases absorption, and quantifying its share against greenhouse warming has produced a wide range of published estimates.
Precipitation trends at high altitude are poorly constrained. Nepal’s station network thins drastically above 3,000 meters, and the DHM analysis found no statistically significant national precipitation trend over 1971 to 2014. Whether high-altitude snowfall is increasing, decreasing or merely shifting in timing is not resolved by the available observations.
Pointing at these gaps is not a reason for doubt about the direction of change. Every monitored glacier in Nepal is receding. The uncertainty is about rates, timing and basin-level detail, not about whether the ice is going.
Frequently asked questions
Does Nepal have eight or fourteen peaks above 8,000 meters?
Both figures are used correctly in different senses. Nepal’s Department of Tourism officially lists fourteen since February 2025, including six subsidiary summits on the Kanchenjunga and Lhotse massifs. Of the world’s fourteen independent eight-thousanders, eight lie wholly or partly in Nepal.
How fast are Nepal’s glaciers retreating?
There is no single national rate, and anyone quoting one is generalizing beyond the data. Yala Glacier in Langtang has retreated 784 meters and lost 66% of its area since the 1970s. Regionally, ICIMOD found HKH glacier loss ran 65% faster in 2011 to 2020 than in the previous decade.
Will Nepal’s glaciers disappear completely?
ICIMOD’s HI-WISE assessment projects up to 80% volume loss across the Hindu Kush Himalaya by 2100 on current emissions trajectories. That is a modeled, scenario-dependent figure, and lower-emissions pathways produce substantially smaller losses.
How many glaciers in Nepal are actually monitored on the ground?
Very few. Across the whole Hindu Kush Himalaya about 38 glaciers have in-situ measurements and only seven have ten or more years of annual monitoring. Most of what is known comes from satellites.
Why was Yala Glacier given a funeral?
ICIMOD and local communities held a tribute in May 2025 marking the effective end of Yala as a glacier and the end of one of the region’s longest monitoring records. Buddhist ritual was performed by the communities for whom these mountains carry religious meaning.
Does glacier melt mean more water in Nepal’s rivers?
Temporarily, then less. Melt output rises as more ice is exposed, reaches a maximum called peak water, then declines permanently. Timing varies by basin and is modeled rather than observed.
Are Nepal’s rivers mainly fed by glaciers?
No. Monsoon rainfall dominates annual discharge. Glacier melt is a small share of the total and a critical share during the dry pre-monsoon months, which is why losing it matters more than the percentage suggests.
Is the warming the same everywhere in Nepal?
No, and the pattern is strongly altitudinal. DHM recorded annual maximum temperature trends of 0.086°C per year in the High Himalaya against 0.021°C per year in the Tarai over 1971 to 2014.
Further reading
The primary sources here are ICIMOD’s HI-WISE assessment and the Department of Hydrology and Meteorology’s Observed Climate Trend Analysis of Nepal.
NepalVue follows the Himalaya as a changing physical system, not a postcard. Save this one, pass it to anyone planning a high-altitude trip, and follow NepalVue for more on Nepal’s ice, rivers and mountain communities.


