



Nepal counted 429 wild tigers in its 2026 national survey, up from 355 in 2022 and 121 in 2009. Chitwan National Park holds 145 of them, more than any other protected area in the country. Those numbers are usually read as a straight conservation success, and in one sense they are. But a population can grow in size while shrinking in genetic variety, and it can run out of room long before it runs out of food. This article looks at what the Chitwan tiger population actually faces now: the genetics underneath the headline count, the territorial pressure that pushes young animals into farmland, and what the evidence does and does not establish.
What the 2026 census found
Nepal runs a national tiger survey roughly every four years. The 2026 count was led by the Department of National Parks and Wildlife Conservation, working with the Department of Forests and Soil Conservation, provincial governments, the Nepal Army and conservation partners, and was released on Global Tiger Day in July 2026.
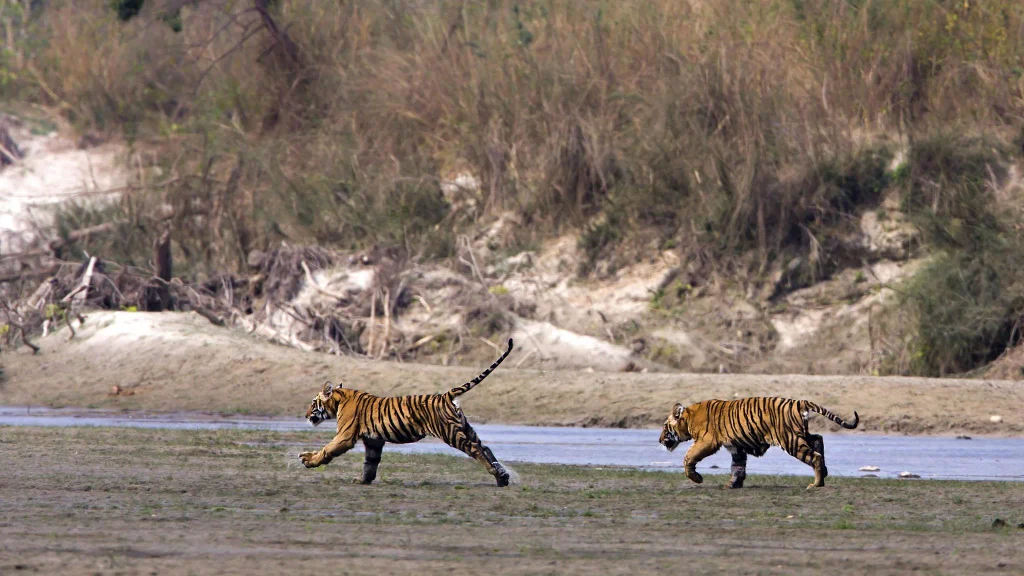
Growth was not evenly spread. Four of the five tiger-bearing parks went up. One went down.


| Protected area | 2022 estimate | 2026 estimate | Change |
|---|---|---|---|
| Chitwan National Park | 128 | 145 | +17 |
| Bardiya National Park | 125 | 112 | -13 |
| Parsa National Park | 41 | 71 | +30 |
| Banke National Park | 25 | 51 | +26 |
| Shuklaphanta National Park | 36 | 50 | +14 |
| Nepal total | 355 | 429 | +74 |
Read across that table and a pattern appears. Chitwan, the oldest and most studied park, grew by about 13 percent. Parsa and Banke, which sit beside older parks and were nearly empty of tigers fifteen years ago, roughly doubled. That is what a saturated source population looks like when it starts exporting animals into adjacent habitat.
Carrying capacity: the number nobody puts on a poster
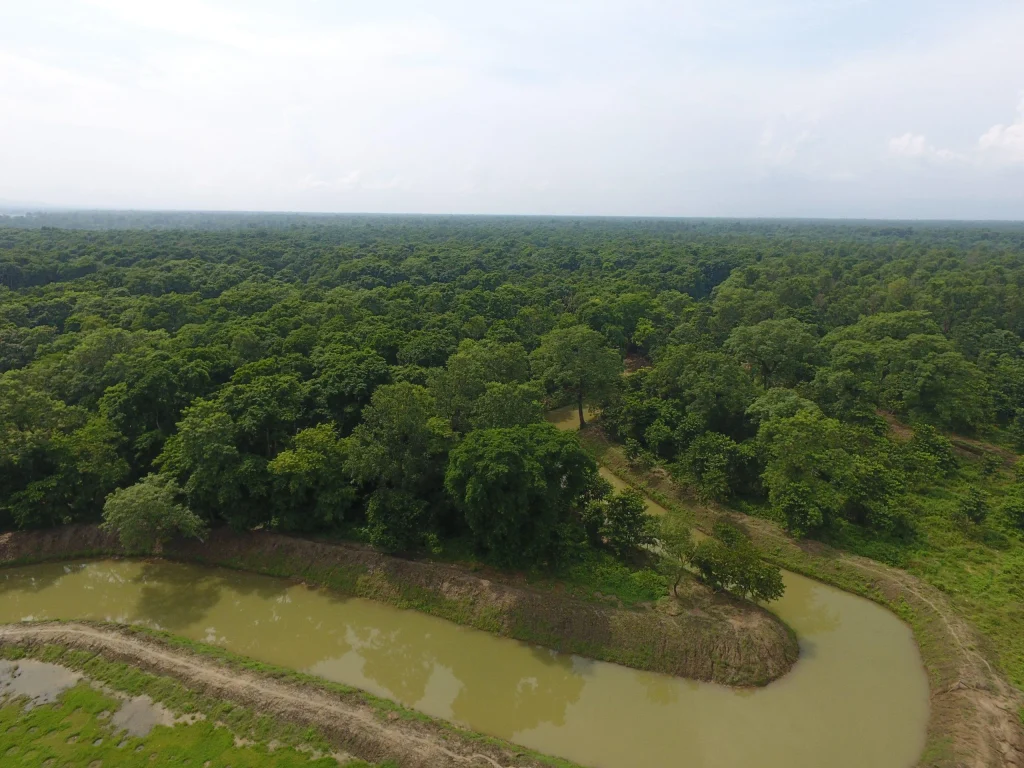
Wildlife biologist Hem Sagar Baral has estimated that Nepal’s protected areas can support roughly 500 tigers, with about 400 in core park areas and another 100 in surrounding forests. If that estimate holds, the 2026 figure of 429 sits close to the ceiling rather than at the start of a long climb.
Carrying capacity is not a fixed property of a landscape. It depends on prey density, water, cover, and how much of the habitat is genuinely usable rather than simply drawn inside a boundary on a map. Estimates vary between researchers and get revised as prey surveys improve, so treat 500 as an informed working figure and not a settled constant.
What the figure does usefully explain is why tigers keep turning up where people live.
Territory, dispersal and the squeeze on young males
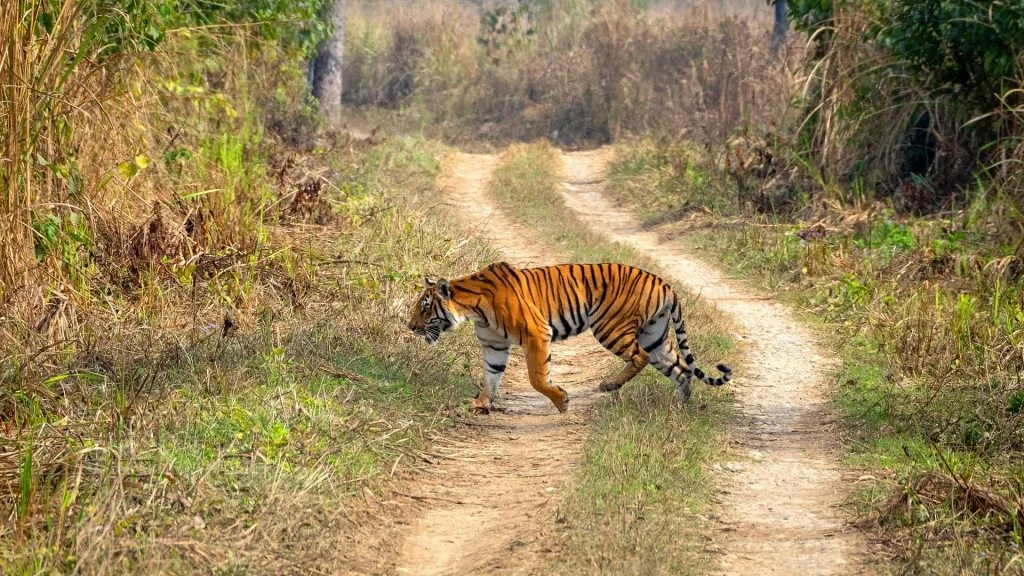
A male Bengal tiger in uncrowded habitat typically holds a home range of 30 to 50 square kilometers. Ashok Ram, warden of Bardiya National Park, has described average home ranges there shrinking to around 7 to 8 square kilometers. Compression on that scale changes behavior.
Here is the mechanism. Resident adults defend the best ground, which is usually the riverine grassland and sal forest with the densest deer and wild boar. Subadults, mostly young males around two to three years old, must leave their natal range and find territory of their own. In a full park there is no vacant good ground. So they take marginal ground: the buffer zone forests, community forest patches, riverbanks beside villages, sugarcane and maize fields. Dispersal is normal tiger biology. What has changed is where dispersal now ends.
Injured, elderly or underweight animals follow the same logic for a different reason. They cannot compete for prime habitat or hold down fast prey, so they shift toward the edges, where livestock and human activity are predictable.
What the conflict data show
A study published in Ecology and Evolution and summarized by the Kathmandu Post in August 2026 recorded 245 tiger attacks on people in Nepal between 2010 and 2024, of which 141 were fatal. Buffer zones accounted for 69.4 percent of attacks. Only 16 attacks, about 6.5 percent, happened inside national parks.
Chitwan alone accounted for 47 percent of recorded attacks over that period, which is unsurprising given its tiger density and the farming population pressed up against its boundary. Yet the direction of travel in Chitwan has been downward: average annual deaths fell from about seven per year in 1998 to 2006 to about five per year in 2010 to 2024.
National Trust for Nature Conservation figures, reported in 2025, show the same decline across the country.
| Fiscal year | Human deaths from tiger attacks, Nepal |
|---|---|
| 2021-22 | 21 |
| 2022-23 | 12 |
| 2023-24 | 10 |
| 2024-25 | 7 |
More tigers, fewer deaths. Haribhadra Acharya, senior ecologist at the Department of National Parks and Wildlife Conservation, has put it plainly: an increase in tiger numbers does not automatically produce more conflict. Tiger expert Baburam Lamichhane estimates that only about 5 percent of tigers ever pose a threat to people, which is why early capture of a specific animal can prevent casualties.
Activity matters more than proximity. Of the recorded deaths, 78 occurred while people were collecting fodder or firewood, 19 while gathering non-timber forest products, 17 while grazing livestock and 11 while fishing. Posture mattered too: of 59 people attacked while crouching or sitting, 44 died, against 29 of 71 attacked while standing or walking. Women made up about a third of attacks but nearly 44 percent of deaths, a gap the study authors link partly to the forest tasks women more often perform and the postures those tasks require.
The genetics question
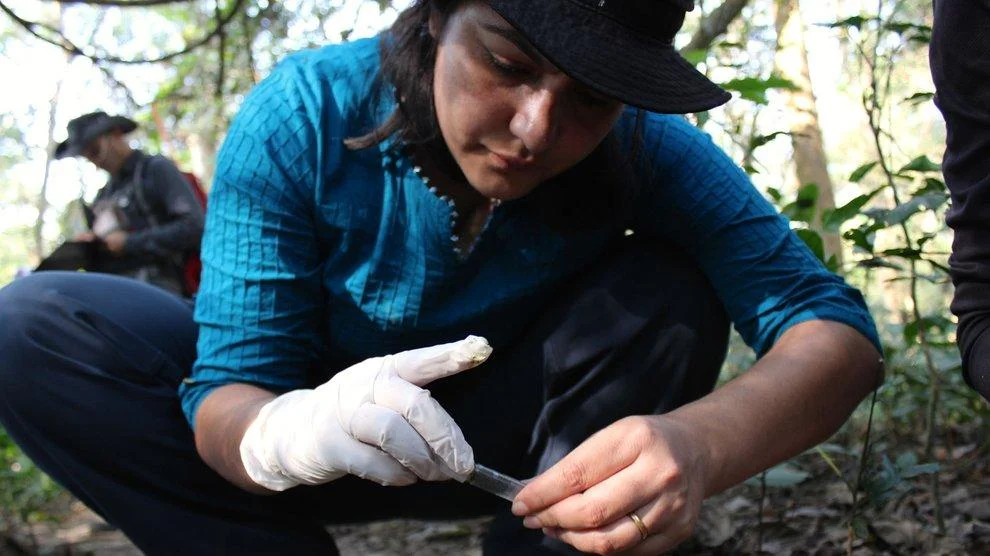
Counting tigers tells you how many there are. It does not tell you how closely related they are, and that is the longer-term risk.
Under the Nepal Tiger Genome Project, researchers carried out the country’s first systematic landscape-scale genetic survey of tigers using non-invasive scat sampling, published in PLOS ONE in 2018. Of 770 samples collected across five protected areas and six suspected corridors, 412 were confirmed as tiger. Microsatellite analysis identified 78 individual animals.
Three results stand out.
- Three genetic clusters. Tigers in the Terai Arc Landscape sorted into three genetic groups matching three demographic subpopulations, rather than forming one continuously mixing population.
- Moderate diversity and moderate differentiation. Expected heterozygosity was 0.61 and allelic richness 3.51, with FST of 0.14. In plain terms, variation has not collapsed, but the groups are measurably distinct from one another.
- A bottleneck signature. Statistical evidence of a past population bottleneck appeared in the data, which the authors link to two centuries of large-scale land-use change in the Terai forests.
- Gene flow still happening. Between three and seven migrants were detected, showing that animals do still move between subpopulations and carry genes with them.
Two definitions help here. Heterozygosity is a measure of how much genetic variation sits within a population: lower values mean individuals are more genetically similar. FST measures how much of the total variation is explained by differences between groups rather than within them, so a higher value means more separation.
The headline conclusion is not that Chitwan’s tigers are inbred. It is that the long-term health of the population depends on animals continuing to move between parks, and that movement runs through corridors outside protected areas.
Why corridors carry the genetic load
A tiger that disperses from Chitwan into Parsa, or from Bardiya into Banke, is doing conservation work no manager can replicate by protecting core habitat alone. Each successful migrant counters genetic drift, the slow random loss of variation that affects small isolated populations hardest.
Corridors are also where tigers meet highways, settlements, cropland and livestock. A 2022 study on roads near Chitwan modeled substantial tiger losses over 20 years under increased traffic scenarios. Note what that is: a model of a projected scenario, not a measurement of animals already lost. Modeled projections and measured counts should not be read as the same kind of evidence.
Where the evidence is thin
Good science writing should say what it does not know.
- No published park-specific inbreeding coefficient for Chitwan alone is available in the sources reviewed here. The 2018 genetics work covers the Terai Arc Landscape as a whole.
- Published summaries of the 2026 census describe totals and park breakdowns, not field methodology in detail. Earlier Nepali surveys have relied on camera trapping combined with prey and habitat assessment, but the 2026 method should be confirmed against the published national report before being quoted.
- Bardiya’s decline from 125 to 112 has been reported, but no peer-reviewed explanation had been published at the time of writing. Possible contributors include survey variation, dispersal into neighboring Banke, prey change and mortality. Treat any single explanation as provisional.
- Carrying capacity estimates vary and are revised as prey data improve.
What this means on the ground
For communities in the buffer zone, the practical issues are compensation, forest access and what happens to a tiger identified as dangerous. Park regulations direct 30 to 50 percent of national park revenue to buffer zone committees. Reporting in 2026 indicated Chitwan’s park revenue exceeded Rs 300 million while committees received roughly Rs 60 to 80 million, a gap residents and committee members have raised publicly. Chitwan has 21 buffer zone committees and one sub-committee.
Removal is the other hard edge. Chitwan was holding seven rescued tigers in limited enclosures as of 2025, and park officials including chief conservation officer Ganesh Panta have called for larger, better-designed facilities. Every animal taken out of the wild for public safety is also an animal removed from the breeding population, which brings the genetics question back around.
For visitors, the useful takeaway is less dramatic. Tigers in Chitwan are not hunting tourists. Attacks cluster around specific forest work at specific times of day, almost entirely in buffer zones rather than on guided park routes. If you are planning a visit, our Chitwan National Park guide covers access and seasons, and the jungle safari guide explains how sightings actually work.
Frequently Asked Questions
How many tigers are in Chitwan National Park?
The 2026 national survey estimated 145 tigers in Chitwan, up from 128 in 2022. Nepal’s national total was 429.
Are Chitwan’s tigers inbred?
No published study shows a Chitwan-specific inbreeding crisis. Landscape-wide genetic work published in 2018 found moderate diversity, three distinct genetic clusters and evidence of a historical bottleneck, with ongoing but limited gene flow between subpopulations.
Why did Bardiya’s tiger numbers fall while others rose?
Bardiya dropped from 125 to 112 between 2022 and 2026. No peer-reviewed explanation was available at the time of writing. Dispersal into neighboring Banke, survey variation, prey changes and mortality are all plausible contributors.
Is tiger tourism in Chitwan dangerous?
Recorded attacks happen overwhelmingly in buffer zones during forest work such as cutting fodder, not on guided safaris inside the park. Between 2010 and 2024, about 6.5 percent of recorded attacks occurred inside national park boundaries.
What is a wildlife corridor and why does it matter for tigers?
A corridor is a strip of habitat linking two larger protected areas. Corridors let young tigers disperse and breed outside their natal population, which maintains genetic variation. Without them, parks become genetic islands.
What happens to a tiger that attacks a person in Nepal?
Park authorities typically attempt capture. Captured animals are usually held in enclosures rather than released, which is why facility capacity has become a live issue. Chitwan held seven rescued tigers in 2025.
Has Nepal reached its maximum tiger population?
Possibly close to it within current protected areas. One widely cited estimate puts capacity at roughly 500 tigers nationally. Future growth may depend more on corridor and buffer zone habitat quality than on core park expansion.
Which other parks in Nepal have tigers?
Bardiya, Parsa, Banke and Shuklaphanta, all in the Terai Arc Landscape. Our guide to Nepal’s tiger national parks compares them, and Bardiya has its own guide.
Sources and further reading
The 2026 census figures come from the IUCN report on Nepal’s national tiger survey. The genetic findings come from the Nepal Tiger Genome Project study published in PLOS ONE (2018).
If you are planning a wildlife trip, visiting Chitwan in September explains how season shapes what you see. Save this guide for your planning, share it with anyone who assumes rising tiger numbers tell the whole story, and follow NepalVue for more reporting on Nepal’s landscapes and the people who live in them.


